Right after celebrating a great LibreOffice 10th Anniversary, we are delighted to present the 2020-version of our LibreOffice growth infoGraphic, including beautiful visuals and interesting numbers! We do hope you appreciate it and would love to hear your feedback. And of course it is great if you find the format, in which it is presented, convenient to share.
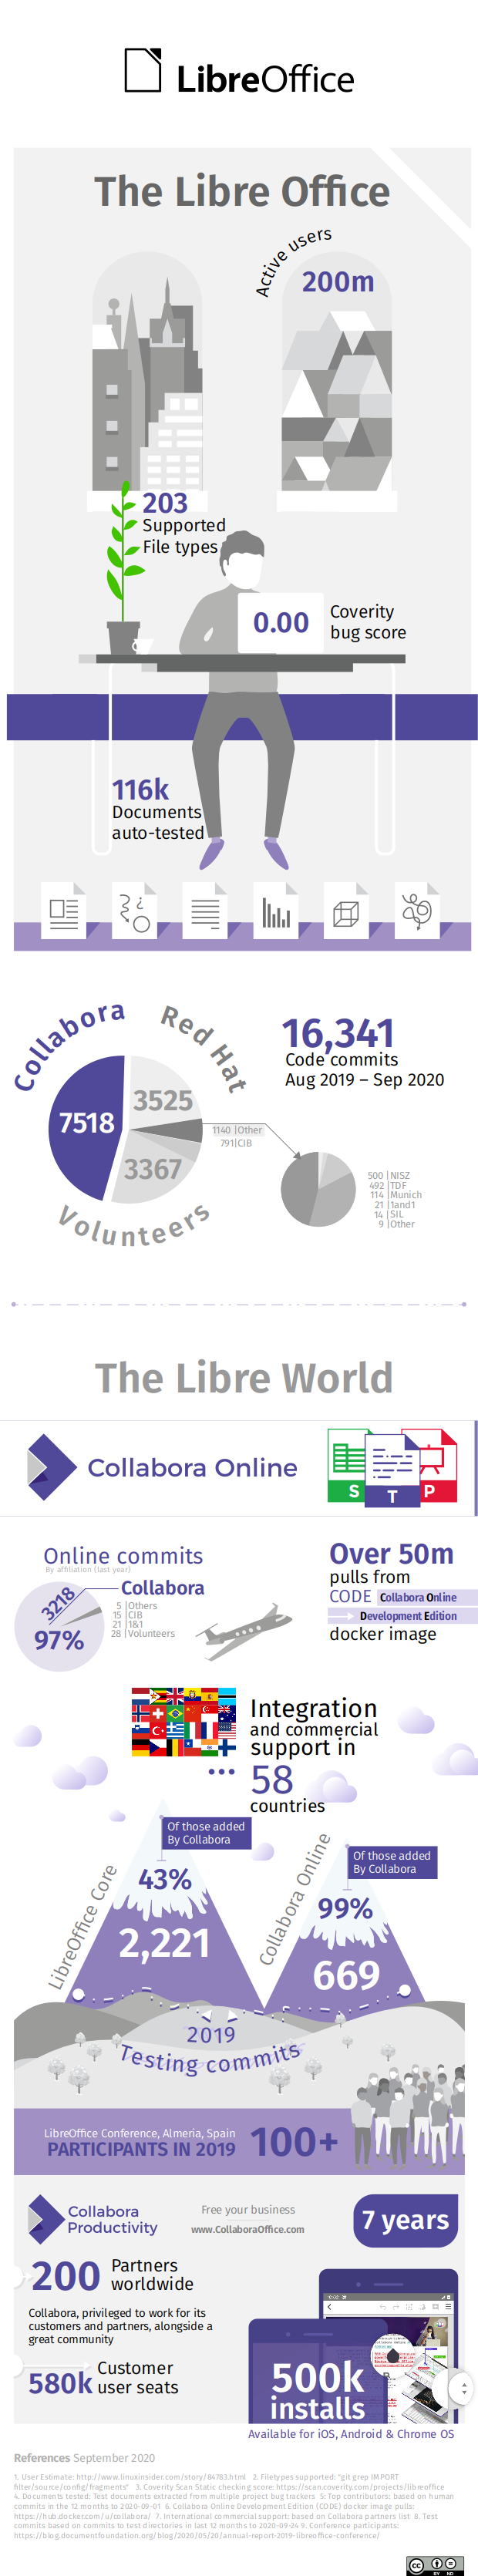
Many numbers are again up. Our devs are top code contributors to LibreOffice with 7518 code commits. And the popular “Collabora Online Development Edition” (CODE), for home use & small teams (find details here), has over 50 million Docker image pulls! We are extremely grateful for all partners and customers working with us to make this possible.
Would you like to see the previous versions; these are here: 2019, 2018, 2017, 2016, 2015, & 2014.
Soon there will be the LibreOffice Conference 2020 (October 14 to October 16), where you can meet developers, including of course our developers, and other contributors from the community, and attend the online sessions of the talks of our developers.
So.. check out the updated LibreOffice growth infoGraphic on 2020 here:


What a lovely looking info graphic! Well done to the designer. And a big well done to the fantastic team and Collabora and the wider LibreOffice community.